How much water flows through a river that has never been measured — and how will that change under a warming climate? For two proposed dams in sub-Saharan Africa, answering both questions is critical. hydrosolutions GmbH developed and applied an end-to-end workflow that combines deep learning-based streamflow reconstruction with bottom-up climate stress testing — without requiring a single local gauge observation.
Years of daily streamflow reconstructed
Local gauge observations required
Donor basins used for model training
Climate scenarios stress-tested
The Challenge
Two proposed dams — one in southeastern Madagascar and one in northern Mozambique — both require at least 30 years of daily streamflow data for reliable reservoir design. Yet neither basin has ever been systematically gauged. The Madagascar dam, for example, would create a large multi-purpose reservoir serving over 300,000 beneficiaries with water supply and irrigation in a chronically water-stressed region. Hydrological monitoring networks across much of Africa have declined for decades, and planners need to understand not only how much water is available today, but how climate change may shift that availability in the decades ahead.
Streamflow Reconstruction: A Four-Stage Deep Learning Workflow
Our approach to prediction in ungauged basins follows four stages.
Stage 1 — Workflow validation. We first reproduce results from well-established studies on well-gauged basins to confirm that our deep learning implementation and global data pipeline perform as expected before applying them to ungauged sites.
Stage 2 — Training data selection. Using the global Caravan dataset — a standardized collection of nearly 24,000 river basins — we classify basins into hydroclimatic clusters based on the shape of their seasonal precipitation, temperature, and streamflow patterns. A Random Forest classifier then assigns each ungauged target basin to its most similar cluster, identifying over 600 donor basins for model training.
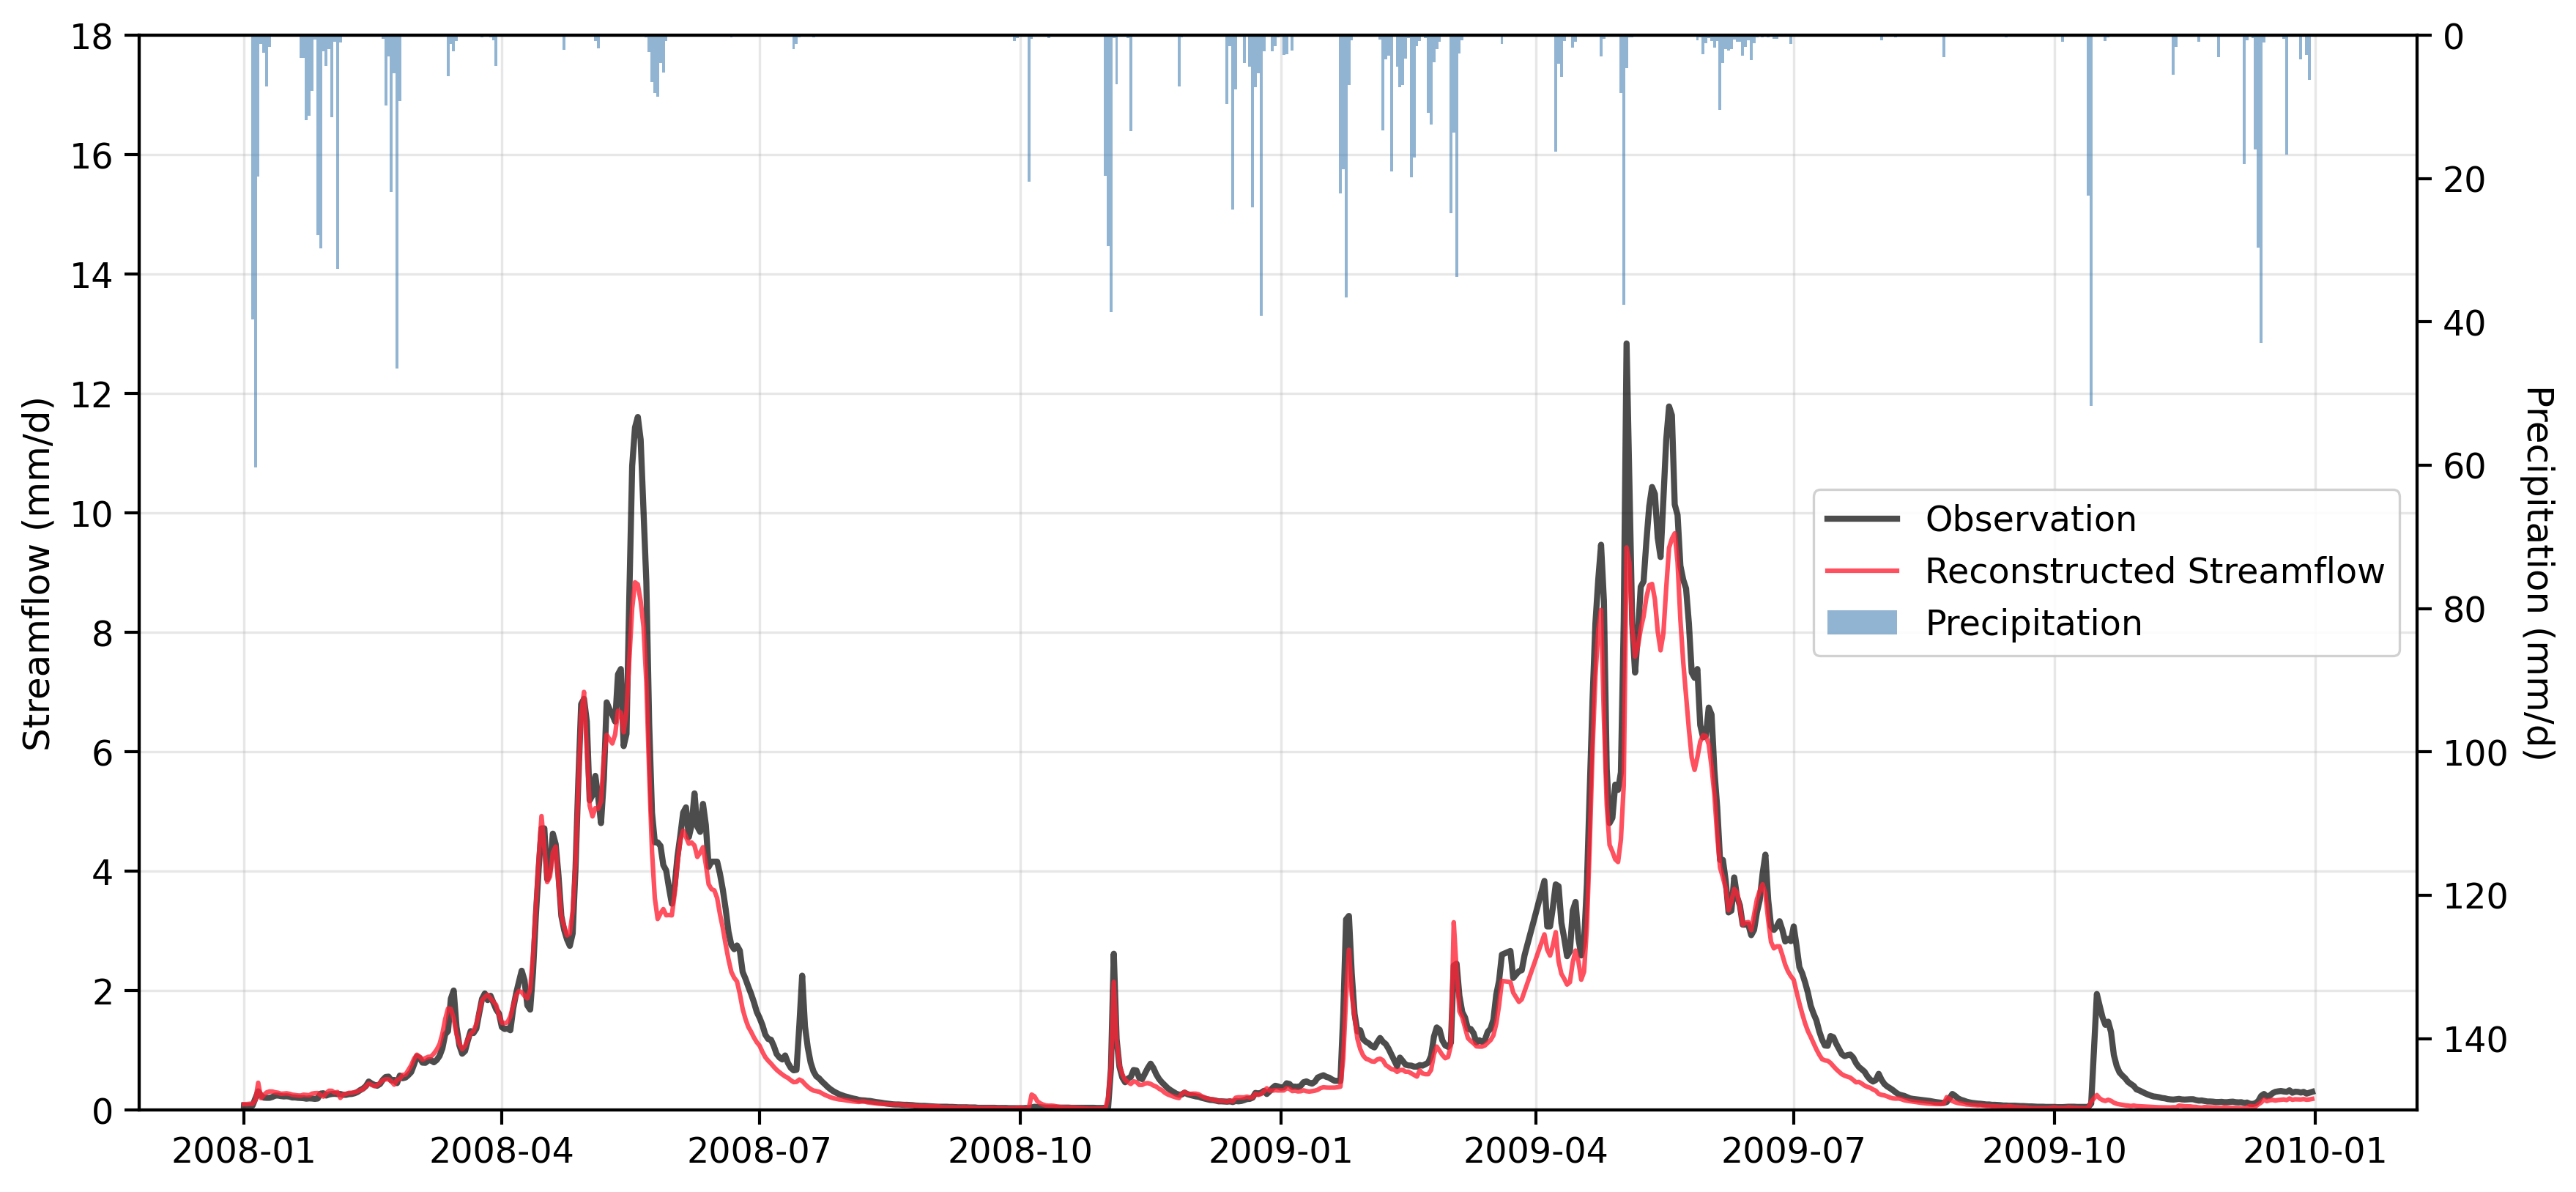
Stage 3 — Model training. Two structurally independent deep learning architectures — LSTM and Mamba — are each trained as 10-member ensembles on the selected donor basins. Rather than relying on a single precipitation product, we fuse four independent satellite and reanalysis datasets simultaneously (ERA5-Land, CHIRPS, CPC, and MSWEP). The models learn to extract complementary information from each source, combining the strengths of the datasets to achieve accuracy comparable to reliable reference data.
Stage 4 — Streamflow reconstruction. The trained ensembles are applied to each target basin using only globally available satellite data and catchment attributes. The result is 44 years of daily streamflow (1981–2025) for each site, with no local calibration data required. Running two independent architectures brackets structural uncertainty — where they agree, confidence grows; where they diverge, it flags where further investigation is needed.

From Reconstruction to Climate Impact Assessment
Deep learning models excel at reconstructing historical streamflow, but they were trained on past climate and may not generalize reliably to the substantially different conditions projected for the coming decades. To assess climate sensitivity, we need a model whose inputs — precipitation and temperature — can be directly perturbed.
We calibrate a GR6J rainfall-runoff model for each basin, using the deep learning reconstruction as surrogate observed streamflow. GR6J is a parsimonious, process-based model that takes only daily precipitation and temperature as inputs. This step transfers the knowledge embedded in the deep learning models into a lightweight framework that can be run thousands of times under perturbed climate conditions.
Climate Stress Testing
Rather than using climate model projections as direct forcing inputs — which propagate cascading uncertainties through long modeling chains — we take a bottom-up approach. We ask: under what climatic conditions does water availability change significantly?
Stochastic weather generation. A stochastic weather generator fitted to the historical record synthesizes realistic sequences of daily weather. It preserves the full statistical structure of the observed climate — including day-to-day transitions, seasonal patterns, and critically, multi-year drought and wet cycles driven by low-frequency climate variability.
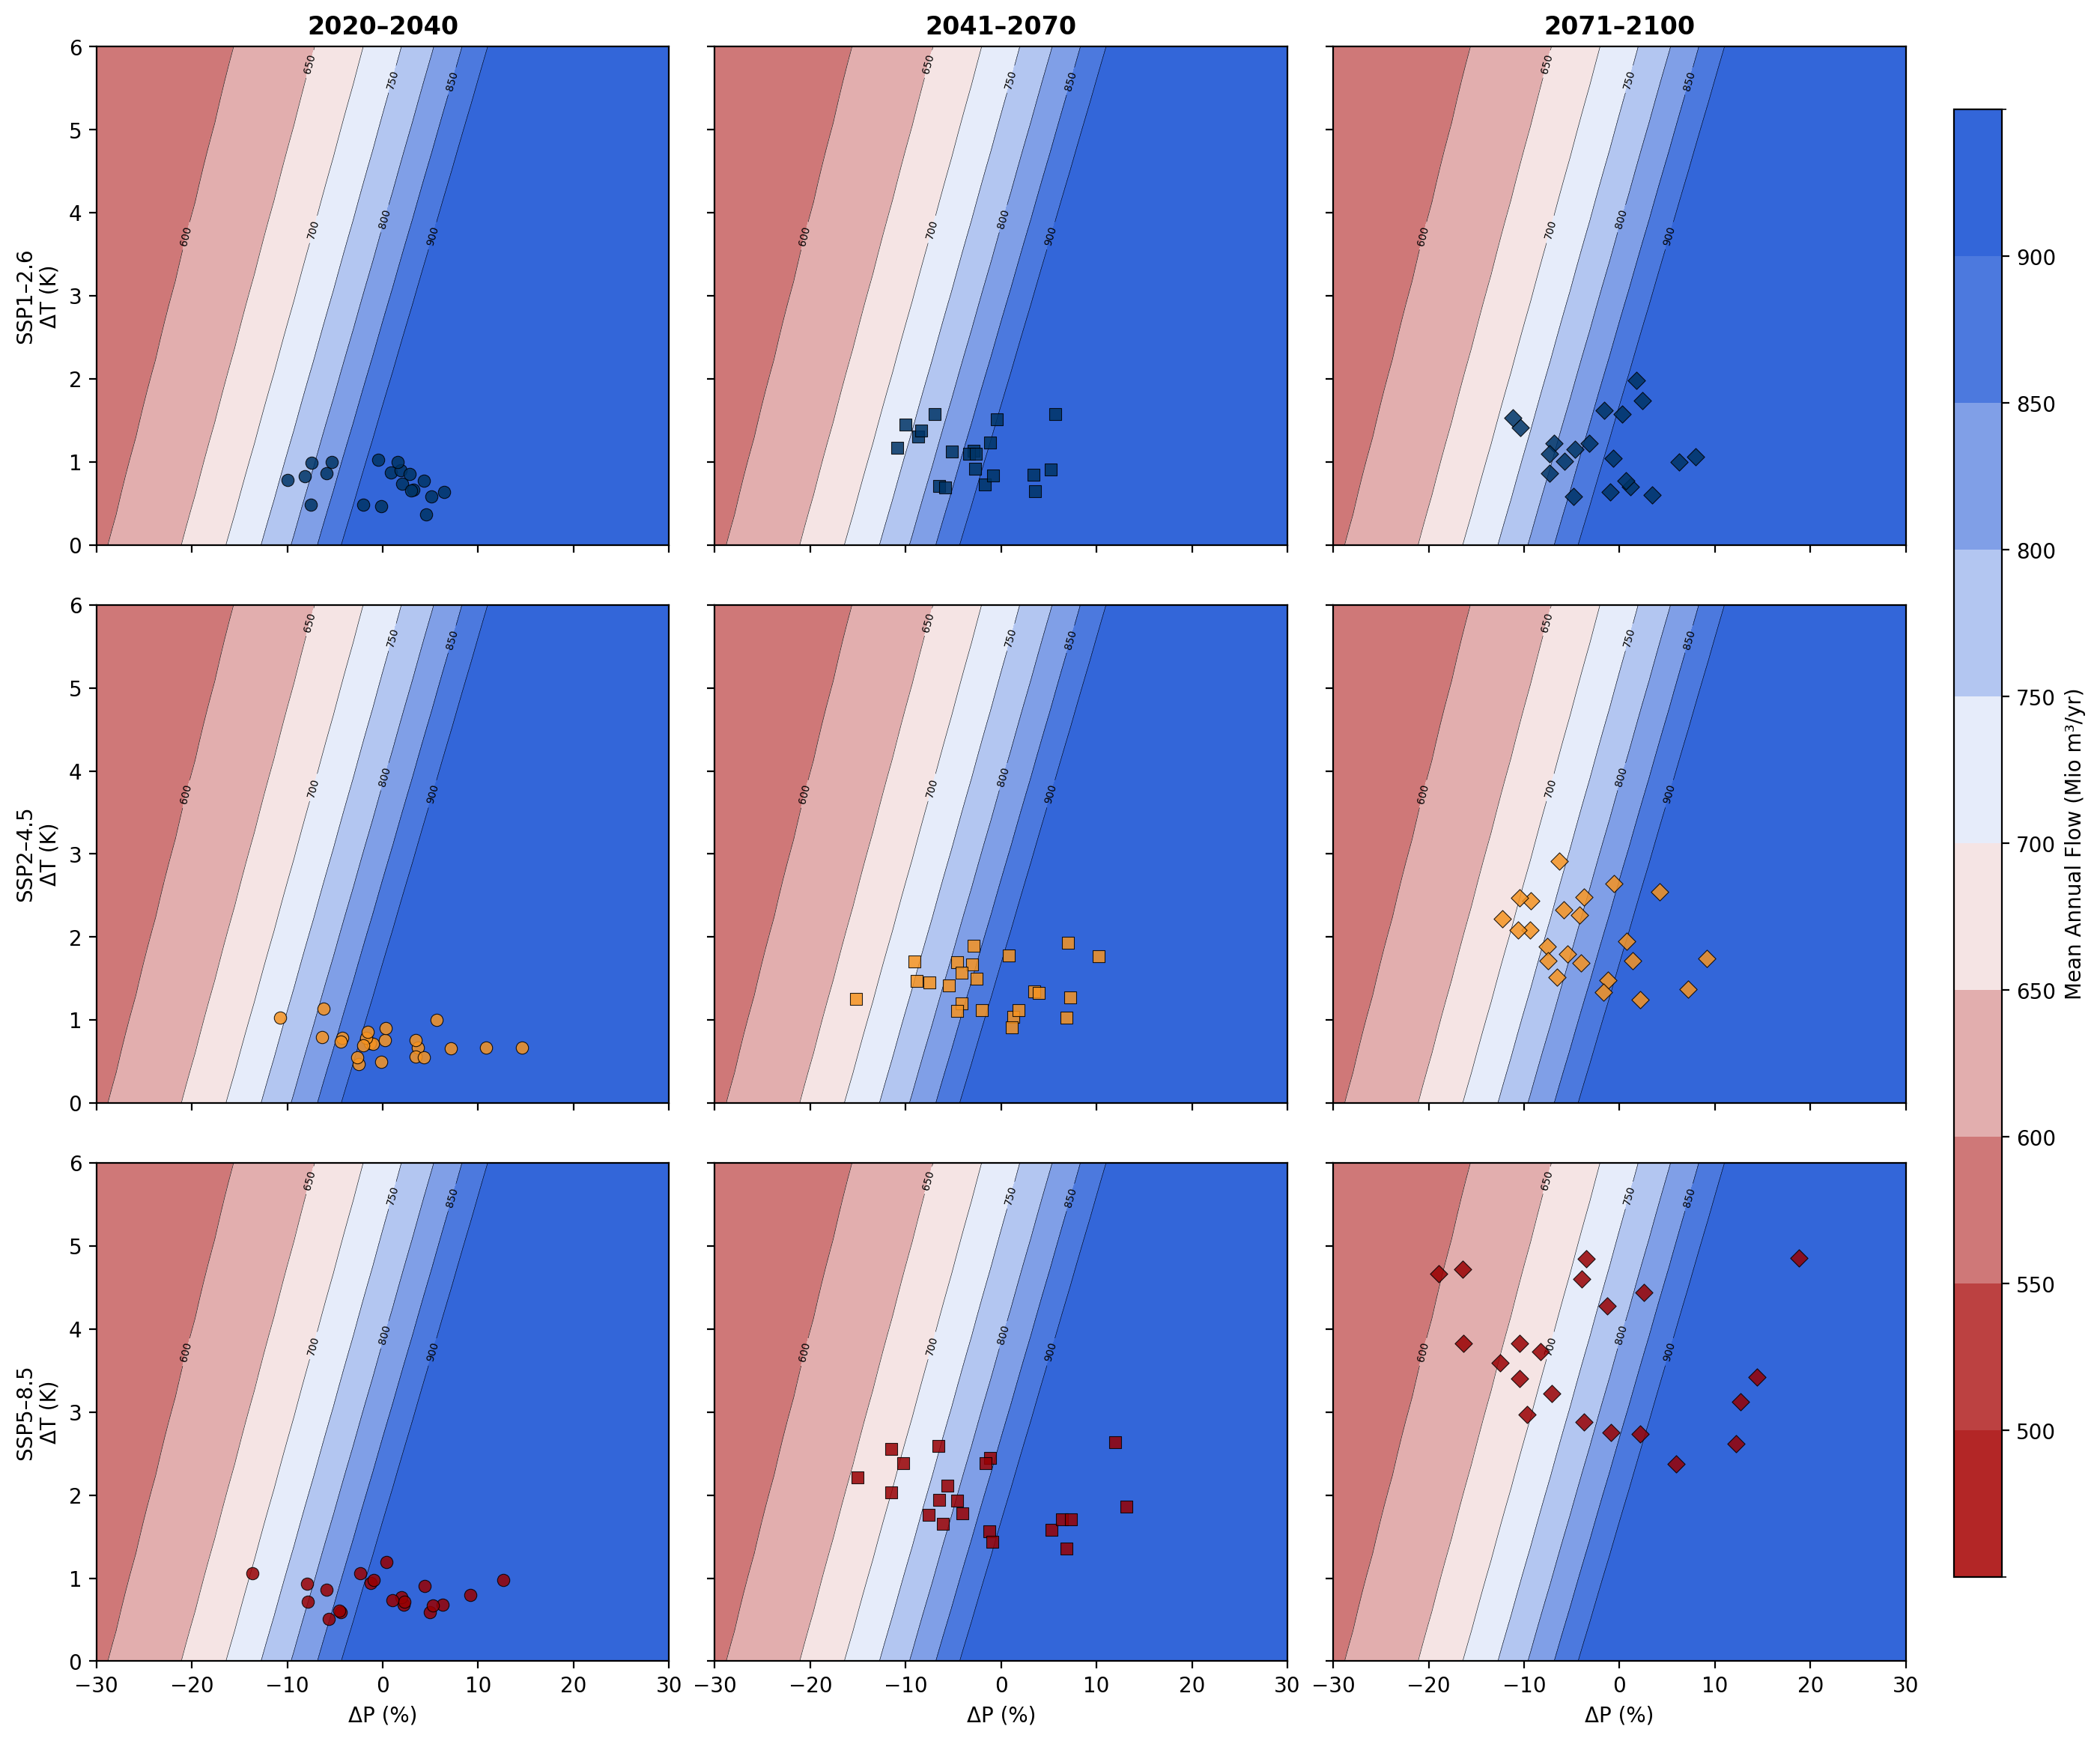
Perturbation grid. The synthetic baseline weather is then systematically perturbed along two axes — temperature change (0 to +6°C) and precipitation change (−30% to +30%) — creating a dense grid of 900 plausible climate scenarios. Each perturbation is applied independently of any climate model: temperature is shifted additively, and precipitation intensity is adjusted through quantile mapping that reshapes the entire rainfall distribution rather than applying a simple scaling factor.
Response surface. For each of the 900 scenarios, we run the calibrated GR6J model and compute hydrological performance metrics. The result is a climate response surface — a two-dimensional map showing how water availability responds across the full space of possible future climates. This surface is built entirely independently of climate projections.
CMIP6 overlay. In the final step, we overlay projections from 26 CMIP6 global climate models across three emission scenarios (SSP1-2.6, SSP2-4.5, and SSP5-8.5) and three time horizons (near-term, mid-century, end-of-century) as points on the response surface. This decouples the sensitivity analysis from the projections: the surface reveals the system’s intrinsic vulnerability, while the projected points indicate which parts of that landscape are most likely to be realized. Decision-makers can see at a glance whether projected futures cluster in regions of concern — or whether the system remains robust across plausible climates.
Outlook
This workflow is designed to be scalable. Once the deep learning models are trained, reconstructing streamflow for a new basin takes seconds. The stress test grid of 900 scenarios runs in under a minute. Screening dozens of potential dam sites or water supply options becomes feasible at a fraction of the cost and time of traditional approaches, making it a powerful complement to conventional hydrological assessments in data-scarce regions.